
California Charter School Landscape
1,350+ charter schools statewide
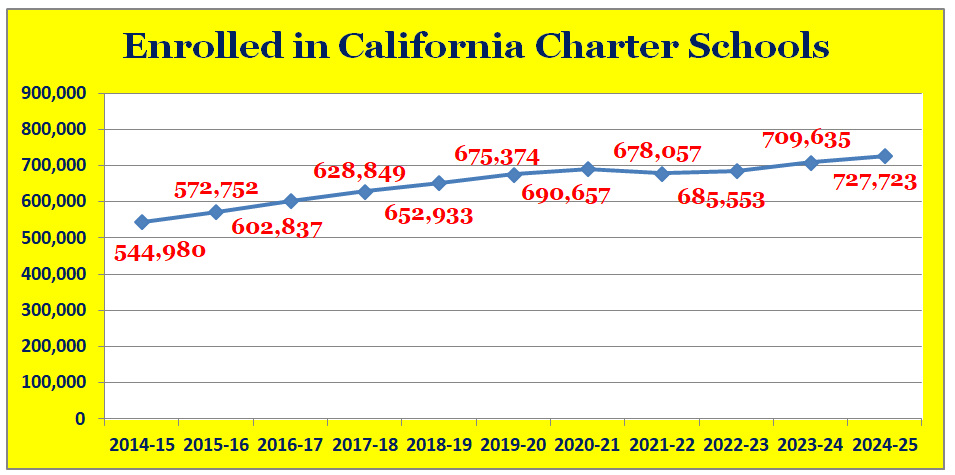
~690,000 students enrolled (≈11% of CA)
52% of charters serve fewer than 500 students
80,000–100,000 students on waitlists
50+ closures (2022–2024), mostly operational/financial
Financial and Operational Pressures
LCFF funding below inflation
SPED costs rising faster than reimbursement
Facilities costs hit small schools hardest
Cash-flow instability common
Back-office quality inconsistent
Governance and Renewal Challenges
AB 1505: 2-, 5-, and 7-year renewals
<10% of charters qualify for 7-year renewal
70%+ of revocations tied to governance issues
Boards lack training in Brown Act + conflict rules
Weak fiscal oversight and data literacy common

Dashboard Performance Trends
60%+ of charter schools score Orange/Red
Elementary: math + suspension rate issues
Secondary: absenteeism + college/career challenges
Small schools show highest volatility
Data systems inconsistent across sites
Common Audit Findings
Attendance accounting errors
SPED documentation issues
Internal control weaknesses
Misuse of restricted funds
STRS/PERS reporting inaccuracies
Why This Data Matters
Most closures are operational, not academic
Small schools lack capacity and robust systems
Staff often hold multiple roles without support
Inconsistent data, finance, and compliance practices
CharterLab strengthens systems and renewal readiness